Mikhail Ponomarenko, Nikolay Kolchanov, Julia Ponomarenko, Anatoly
Frolov,
Olga Podkolodnaya, Denis Vorobiev, Nikolay Podkolodny#, G. Christian Overton&
Institute of Cytology and Genetics, Novosibirsk, Russia;
#
Institute of Computational Mathematics and Mathematical Geophysics, Novosibirsk, Russia&
Center for Bioinformatics, University of Pennsylvania, Philadelphia, USAWe suggest a new approach to predict the activity of DNA functional sites that is focused on the perspicuity of the prediction in terms of “a probable molecular mechanism of the site functioning”. The biological novelty of the method is in the involvement of physico-chemical and conformational DNA properties to provide clear interpretation of the obtained activity predictions in terms of a probable molecular mechanism of the site functioning. For the DNA feature analyzed, the mean value of a given DNA property averaged for a given region containing the site is calculated and studied. This approach has allowed to create a distributed and intelligent database ACTIVITY for the functional site activity prediction. Currently, this database contains the description of over 240 experiments, over 30 conformational and physico-chemical properties, the DNA features identified as applicable for predicting the site activities, and the C-code programs predicting the activity of these sites from their sequences. ACTIVITY is URL /mgs/systems/activity/.
Mulligan (1984) was first to predict the activity Kbk2 of E. coli promoters through homology score. Using multiple regressing the weight matrixes, Stormo (1986) predicted the DNA site activities for su2 suppression and 2-aminopurine-induced mutations, and the operator-binding activity of the Mnt repressor in Salmonella phage P22 (Fields, 1997). Berg and von Hippel (1988) established the statistical-mechanical theory to describe the sequence-dependences of the DNA/protein interactions and applied it to predict the activities of CRP- and Cro-binding sites and E. coli promoters. Jonsson (1993) introduced neural networks to predict the E. coli promoter strength. Neural networks were also applied for predicting the INR and TATA box activities(Kraus, 1996).
In our previous works, we have introduced the system ACTIVITY (Ponomarenko, 1997a) generating programs to predict site activities using weighted oligonucleotide concentrations, and, then, applied this system to predict the consensus site maximizing the affinity between DNA and TBP protein (Ponomarenko, 1997b). This consensus was found to be similar to the well-known Bucher’s consensus (1990) of the TATA box. Nevertheless, a probable molecular mechanism of the DNA functional sites functioning remains obscure in terms of either oligonucleotide concentrations (Ponomarenko, 1997a,b), the weighted matrix (Stormo, 1986), or neural network (Jonsson, 1993).
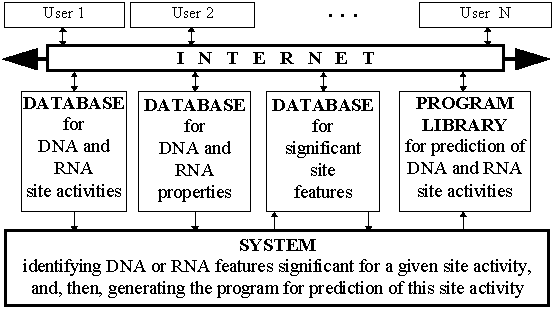
With this background, we developed the distributed and intelligent database ACTIVITY on the activities of the DNA functional sites. The database ACTIVITY comprises: (1) the database of the experimental data on site sequences with known activities; (2) the database of the conformational and physico-chemical DNA properties; (3) the knowledge base of the DNA features which is the mean values of the DNA properties significant for predicting the site activity; (4) the library of the programs predicting the site activities. ACTIVITY is /mgs/systems/activity/.
We are suggesting a linear regression for predicting activities of the DNA functional sites. The biological novelty of the method is in the involvement of physico-chemical and conformational DNA properties to provide clear interpretation of the obtained activity predictions in terms of a probable molecular mechanism of the site functioning. Mean values of conformational or physico-chemical DNA properties are named “DNA features” in this work. They are easiest to interpret relative to the molecular mechanism defining the activity value of a given site, whereas it is hard to guess in advance what DNA feature is responsible for the site activity. That is why we suggest to generate and test as many DNA features as the computer can afford, as it was introduced by Hajek and Havranek (1978). In our previous papers (Ponomarenko, 1997a, b), this “generating and testing” approach (Hajek, 1978) has been successfully applied for revealing the oligonucleotide concentration applicable to predict the activity of a given functional site from its sequence. However, the concentrations proved to be uncertain in terms of a probable molecular mechanism of the site functioning. For this reason, this paper is focused on the conformational and physico-chemical DNA properties.
The core idea of the linear regression implies that the site activity F is determined by simultaneous action of two types of the site features X: obligatory and facultative. The obligatory features of a given site are invariant for all sequences of this site and determine its basal activity. Consensus is a typical obligatory feature. The facultative features of a given site are individual in terms of their “number, size, and location” for each sequence of the site and modulate the site activity with respect to the basal level. Hence, within the framework of the linear regression, the activity of the site with sequence S is described by the following equation:
![]() , (1)
, (1)
where, F0 is the basal activity level of the sites studied; Xk(S) is the value of the k-th facultative feature of the sequence S; and Fk is the contribution of the feature Xk to the site activity F.
Local conformational DNA heterogeneities dependent on the nucleotide context play an important role in DNA-protein interactions, which essentially determine the site activity. That is why the prediction of site activity takes into account the DNA conformational properties describing the mutual orientation and locations of base pairs. Also, we used the earlier published values of physico-chemical properties averaged for the known X-ray structures including melting temperature, persistent length, entropy, etc. These properties determine the molecular dynamics of DNA sites during their functioning. Currently, 38 conformational and physico-chemical properties are utilized in prediction of the site activities. Thus, the sequence of the site S can be characterized by the mean value of the q-th property Rq averaged over the region between positions a and b:
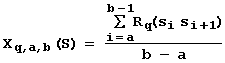 , (2)
, (2)
It should be emphasized that before starting the analysis, we knew very little about the B-DNA physico-chemical and conformational features Xq,a,b that would be most important for the activity of a given site under study. The only available data were certain sequences with the known activities. With this in mind, the artificial intelligence principle of impartiality is applicable: when the information is insufficient, the more hypotheses have been generated and tested, the more correct is the result, and no preference, therefore, might be given to any hypothesis before its testing (Hajek, 1978). In this paper, each hypothesis is the assumption that a conformational or physico-chemical features calculated by equation (2) is significant for the activity of the site examined. Thus, we test, one by one, all the possible variants of conformational or physico-chemical properties Rq, exhausting all the possible regions (a, b) within the site examined. In this way, for a fixed “q, a, b”, the conformational or physico-chemical feature Xq,a,b(Sn) is calculated by equation (2) for each sequence Sn with the known activity Fn. The total number of the DNA features Xq,a,b is about 105. Essentially, when such a large number of hypotheses is generated and tested, the problem to exclude any insignificant hypothesis chosen by chance becomes crucial. In this paper, we are suggesting to cross this problem within the framework of utility theory for decision making (Fishburn, 1970) and Zadeh’s fuzzy logic (Zadeh, 1965) as follows.
Let’s calculate a fixed feature Xq,a,b(Sn) for each sequence Sn with the known activity Fn by equation (2). If the resulting pairs {Xq,a,b(Sn), Fn} meet all the necessary conditions of the linear regression (equation 1) applicability, then the activity F is predictable from an arbitrary sequence S via the feature Xq,a,b(S). To test these conditions of linear regression applicability, a simple regression is optimized for the pairs {Xq,a,b(Sn), Fn}:
Fq,a,b(Sn)= f0 + f1 x Xq,a,b(Sn); (3)
where f0 and f1 are the regression coefficients optimized for the pairs {Xq,a,b(Sn), Fn}.
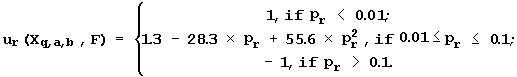
To ensure the reliability of the regression between Xq,a,b(Sn) and Fn values, 22 conditions of regression analysis are tested: the presence of linear, sign, and rank correlations between the predicted Fq,a,b(Sn) and the experimental activities Fn; the equality of distributions of these values; the Gaussian distribution of their deviation (Fq,a,b(Sn)-Fn), etc. When testing each of the 22 conditions, the significance level pr, at which the rth condition is met, is estimated. In Zadeh’s fuzzy logic (Zadeh, 1965), each estimation pr is transformed into a uniform scale, that is, the so-called “partial utility of the usage of the feature Xq,a,b to predict the activity F”, as follows:
 (4)
(4)
The highest partial utility ur=1 is assigned to the feature Xq,a,b, if the rth condition is met at significance pr <0.01. The utility is the lowest, ur= - 1, if the rth condition is not met (pr > 0.1). The intermediate partial utility, - 1<ur<1, is assigned to the feature Xq,a,b that meets the rth condition with an intermediate significance, 0.01<pr<0.1 (ur<0 if pr>0.05, ur=0 if pr=0.05, and ur>0 if pr<0.05).
In the utility theory for decision making (Fishburn, 1970), the averaging of all the 22 partial utilities gives the integral utility of the usage of the feature Xq,a,b to predict the activity F:
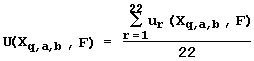 . (5)
. (5)
Only the linearly independent features Xq,a,b with the highest positive utilities are selected:
U(Xq,a,b,F) > 0. (6)
The utility U(Xq,a,b,F) is positive, if the feature Xq,a,b meets more than a half of the 22 conditions of the linear regression applicability. The probability to select by chance a feature X with a positive utility U(X, F)>0 from 105 features was approximately estimated by the binomial criterion:
![]() . (7)
. (7)
Equation (7) shows that each conformational or physico-chemical B-DNA feature Xq,a,b selected by equation (6) meets significantly the linear regression applicability for predicting the site activity.
We used a simple combinatorial algorithm, schematically shown in Fig. 1. The essence of this algorithm is the following. The notion of a combinatorial algorithm implies that all the 105 possible features Xq,a,b(Sn) for all the available site sequences Sn with the known activities Fn are calculated by equation (2), and hence, all the 105 necessary utilities U(X, F) are estimated by equations (3), (4), and (5). When all U(Xq,a,b, P)<0, the algorithm terminates and no features are selected. If U(Xq,a,b, P)>0, all the possible linear-independent features {Xk} with highest positive {U(Xk, F)>0} are selected; the linear regression (1) for predicting the site activity is derived; the C-code program for this prediction is generated (Ponomarenko, 1997a) and stored in the database ACTIVITY.
This algorithm has been implemented with Borland C compiler on IBM PC platform to develop the distributed and intelligent database ACTIVITY shown schematically in Fig. 2. It contains three databases of the SRS query language format (Etzold, 1993), the computer system generating programs for predicting site activities (Ponomarenko, 1997a), and the library of the executable code of these programs predicting activities of DNA functional sites from their sequences. The database ACTIVITY is WWW-available at URL/mgs/system/activity/.
The most important novelty of the ACTIVITY is the database of DNA site activities. Currently, it describes 248 samples exemplified in Table 1. Among them are promoters and binding sites for different E. coli regulatory proteins, TATA boxes and binding sites for various eukaryotic transcription factors, mutation hotspots, and many others. The quantitative values characterizing specific site activities include the association and dissociation rates, affinity, lifetime of the DNA/protein complexes, transcription activity, mutation and cutting frequencies, etc. The database format is exemplified in Fig. 3 by the transcription activity of the mouse alphaA-crystalline gene promoter with the PE1B/TATA box region (-33, +3) relative to the transcription start (Sax, 1995).
The ACTIVITY contains also the database of conformational and physico-chemical properties of the B-DNA. The current version of the database comprises over 30 properties; some of them are listed in Table 2. As an example, the SRS-based format (Etzold, 1993) of the physico-chemical property “Probability to be contacting nucleosome core” in the database is shown in Fig. 4.
The ACTIVITY is also citing all the compiled experimental data on the functional DNA site activities and the conformational and physico-chemical DNA properties in the special database, containing currently over 140 references.
These data on site activities and DNA properties are starting data for the computer system to generate programs predicting the site activity, developed earlier for weighted oligonucleotide concentrations (Ponomarenko, 1997a) and modified for the conformational and physico-chemical DNA features Xq,a,b which are the meav values of the respective DNA properties Rq averaged on a given site region (a,b) by formula (2) herein. The system output for initial data on the transcription activity of the mouse alphaA-crystalline gene promoter containing the PE1B region near the TATA box (see the experimental data shown in Fig. 3) is demonstrated in Fig. 5. This output is stored into the knowledge base containing the significant DNA features for predicting activity (see the scheme in Fig. 2). “Probability to be contacting with nucleosome core”, Pnucl, appeared to be the most significant physico-chemical feature of alphaA-crystalline gene promoter PE1B/TATA box region; the values for each of the 16 possible dinucleotide steps are shown in Fig. 4. The mean value of this property averaged over the region, the significant B-DNA feature, correlates negatively with transcription activity (Fig. 6a). This negative correlation is pinpointing that the tighter is the interaction of the promoter with nucleosomes, the lower is the transcription activity. This result is consistent with both the experimental data showing that nucleosome displacement from a promoter precedes the TBP/TATA binding (Godde, 1995; Edmondson, 1996) and our previous results (Ponomarenko, 1997c) that the nucleosome binding site and the basal promoters differ essentially in their B-DNA helical conformations by their mean Twist angles (maximal and minimal, respectively). The analysis performed has also demonstrated that such conformational properties as major groove width distance, dist (Fig. 6b), and angle Tilt (Fig. 6c) are of importance for the transcription activity. Using the mean values of these DNA properties, the linear regression (1) predicting the transcription activity of alphaA-crystalline gene promoter was derived (Table 3):
F= - 39 - 0.1x Pnucl + 12x DIST - Tilt, (8)
In Fig. 6d, the linear correlation coefficient r=0.90 shows the significant agreement between the experimental transcription activity and the activity predicted by equation 8.
Several dozens of the DNA functional sites analyzed by the Activity are listed in Table 3 and Fig. 7 to demonstrate the universality of the linear regression (1). For all these exemplifying sites, the significant physico-chemical and conformational features have been identified and the linear regressions predicting the site activities have been derived. Let’s consider these examples in detail.
Analysis of the sequences with known DNA bending in the TBP/TATA complex (Starr, 1995) has shown that the bending increases with the inclination (Fig. 7a). Similar results were obtained by the X-ray analysis of the TBP/TATA complexes (Juo, 1996). DNA bending in these complexes results from intercalation of four phenylalanines of the TBP between adjacent base pairs on the side of the minor groove (Juo, 1996). The Inclination describes the rotation angle of a pair of bases along the short axis of this pair; the increase in the angle widens the minor groove (Dickerson, 1989), thereby facilitating the intercalation of phenylalanines in the minor groove and, hence, DNA bending.
Fig. 7b illustrates the negative correlation of B-helical twist angle and the promoter affinity for the upstream stimulating transcription factor USF (Bendall, 1994) (Table 3: r=-0.896, p<10-5). The twist also correlates negatively (r=-0.766, p<10-3) with the activity of another transcription factor (YY1) binding site (Fig. 7d). These two negative correlations are pinpointing independently that the lowest twist may be an important characteristic of a possible molecular mechanism of transcription initiation on eukaryotic promoters. Indeed, this is consistent with our earlier result (Ponomarenko, 1997c) that the lowest twist is the significant DNA feature of the all known eukaryotic promoters.
Finally, Fig. 7d demonstrates that even an exotic DNA functional site activity, such as the mutability induced by the 2-aminopurine (Coullondre, 1978) increases with the DNA melting temperature in the vicinity of the hotspots (r=0.90, a <10-5). This physico-chemical correlation is in agreement with the commonly accepted fact (Mhaskar, 1984) that the 2-aminopurine-induced mutability results from repair errors that are more frequent to the left of the G:C base pairs exhibiting the highest DNA melting temperature than the A:T base pairs having the lowest melting temperature. Very close estimates (r=0.865 and r=0.860, respectively) were obtained earlier using weight matrices (Stormo, 1986) and the method for oligonucleotide concentrations (Ponomarenko, 1997a), and these contextual correlations observed earlier have not unambiguously indicated the repair errors dependent on DNA melting temperature as a possible molecular mechanisms of the DNA mutability.
Summing up, we would like to underline that the linear regression (equation 1) derived for predicting site activities can be informative in a wide range of in molecular biological studies. Substantially, the ACTIVITY does not require a huge body of initial experimental data. Further development of this our approach will be focused on the accumulating of experimental data on the functional DNA site activity because there is no another database for this field of intense research, as yet. Also, we are going to extend the database of conformational and physico-chemical properties of the B-helical DNA and to complement the linear regression model of the molecular mechanisms responsible for the functional DNA site activity by more complex and informative non-linear ones accounting interrelation of the significant DNA features of a given site during this site functioning. In this way, our final goal is to amplify our earlier approach for the simulation of the DNA sequences of a given functional site maximizing this site activity which is now based on the heuristic molecular mechanisms of this site functioning (Ponomarenko, 1997b) by using the significant conformational and physico-chemical features of the site to describe this site functioning much more reasonably.
ACTIVITY is Web-available on URL http://wwwmgs.bionet.nsc.ru/mgs/systems/activity/.
We are grateful to Ms. Galina Chirikova for help in translation. This work was supported by NIH Grant 2-R01-RR04026-08A2, Russian National Human Genome Project, Russian Ministry of Science and Technical Politics, Siberian Branch of Russian Academy of Sciences IGSBRAS-97N13, and Russian Found for Basic Research 96-04-50006, 97-07-90309, 97-04-49740, 98-07-90126.
REFERENCES
Bendall, A.J., and Molloy, P.L., (1994) Base preferences for DNA binding by the bHLH-Zip protein USF: effects of MgCl2 on specificity and comparison with binding of Myc family members. Nucleic Acids Res., 22, 2801-2810.
Berg, O.G., and von Hippel, P.H., (1988) Selection of DNA binding sites by regulatory proteins. II. The binding specificity of cyclic AMP receptor protein to recognition sites. J. Mol. Biol., 200, 709-723.
Boyd, D.C., et al., (1995) Functional redundancy of promoter elements ensures efficient transcription of the human 7SK gene in vivo. J. Mol. Biol., 253, 677-690.
Burset, M., and Guigo, R., (1996) Evaluation of gene structure prediction programs. Genomics, 34, 353-367.
Chiang, L.W., and Howe, M.M., (1993) Mutational analysis of a C-dependent late promoter of bacteriophage Mu. Genetics, 135, 619-629.
Coulondre, C., et al., (1978) Molecular basis of base substitution hotspots in Escherichia coli. Nature., 274, 775-780.
Dickerson, R.E., et al., (1989) EMBO Workshop, EMBO J., 8, 1-4
Edmondson, D.G., and Roth, S.Y., (1996) Chromatin and transcription. FASEB J., 10, 1173-1182.
Etzold, T., and Argos, P., (1993) SRS - an indexing and retrieval tool for flat file data libraries. Comput. Appl. Biosci., 9, 49-57.
Fickett, J.W., and Hatzigeorgiou, A.G., (1997) Eukaryotic promoter recognition. Genome Res., 7, 861-878.
Fields, D.S., He, Y., Al-Uzri, A.Y., and Stormo, G.D. (1997) Quantitative specificity of the Mnt repressor. J. Mol. Biol., 271, 178-194.
Fishburn, P.C., (1970) Utility Theory for Decision Making, New York: Jonh Wiley & Sons.
Gartenberg, M.R., and Crothers, D.M., (1988) DNA sequence determinants of CAP-induced bending and protein binding affinity. Nature, 333, 824-829.
Godde, J.S., Nakatani, Y., and Wolffe, A.P., (1995) The amino-terminal tails of the core histones and the translational position of the TATA box determine TBP/TFIIA association with nucleosomal DNA. Nucleic Acids Res., 23, 4557-4564.
Gorin, A.A., Zhurkin, V.B., and Olson, W.K., (1995) B-DNA twisting correlates with base-pair morphology. J. Mol. Biol., 247, 34-48.
Hajek, P., and Havranek, T., (1978). Mechanizing hypothesis formation - Mathematical foundations for a general theory. Heidelberg, Springer Verlag.
Hogan, M.E., and Austin, R.H., (1987) Importance of DNA stiffness in protein-DNA binding specificity. Nature, 329, 263-266.
Hyde-DeRuyscher, R., Jennings, E., Shenk, T., (1995) DNA binding sites for the transcriptional activator/repressor. Nucleic Acids Res., 23, 4457-4465
Jonsson, J., et al. (1993) Quantitative sequence-activity models (QSAM)-tools for sequence design. Nucleic Acids Res., 21, 733-739.
Juo, Z.S., Chiu, T.K., et al. (1996) How proteins recognize the TATA box. J. Mol. Biol., 261, 239-254.
Karas, H., Knuppel, R., Schulz, W., Sklenar, H., Wingender, E., (1996) Combining structural analysis of DNA with search routines for the detection of transcription regulatory elements. Comput Appl Biosci., 12, 441-446.
Kim, J.G., Takeda, Y., Matthews, B.W., Anderson, W.F., (1987) Kinetic studies on Cro repressor-operator DNA interaction. J. Mol. Biol., 196, 149-158.
Kraus, R.J., et al. (1996) Experimentally determined weight matrix definitions of the initiator and TBP binding site elements of promoters. Nucleic Acids Res., 24, 1531-1539.
Kretsovali, A., and Papamatheakis, J., (1995) A novel IL-4 responsive element of the E alpha MHC class II promoter that binds to an inducible factor. Nucleic Acids Res., 23, 2919-2928.
Mhaskar, D.N., and Goodman, M.F., (1984) On the molecular basis of transition mutations. Frequency of forming 2-aminopurine-cytosine base mispairs in the G X C----A X T mutational pathway by T4 DNA polymerase in vitro. J. Biol. Chem., 259, 11713-11717.
Mulligan, M.E., et al. (1984) Escherichia coli promoter sequences predict in vitro RNA polymerase selectivity. Nucleic Acids Res. 12, 789-800.
Ponomarenko, M.P., Kolchanova, A.N., and Kolchanov, N.A., (1997a).Generating programs for predicting the activity of functional sites. J. Comput. Biol., 4, 83-90
Ponomarenko, M.P., Savinkova, L.K., et al. (1997b) Modeling TATA-box sequences in eukaryotic genes. Mol Biol (Mosk)., 31, 726-732.
Ponomarenko, M.P., Ponomarenko, J.V., et al. (1997c) Computer analysis of conformational features of the eukaryotic TATA-box DNA promotors. Mol Biol (Mosk)., 31, 733-740.
Shpigelman, E.S., et al. (1993) CURVATURE: software for the analysis of curved DNA. Comput. Appl. Biosci., 9, 435-140.
Sax C.M., Cvelk A., et al., (1995) Lens-specific activity of the mouse alphaA-crystallin promoter in the absence of a TATA box: functional and protein binding analysis of the mouse alpha A-crystallin PE1 region. Nucleic Acids Res., 23, 442-451.
Starr, D.B., Hoopes, B.C., and Hawley, D.K., (1995) DNA bending is an important component of site-specific recognition by the TATA binding protein. J. Mol. Biol., 250, 434-446.
Stormo, G.D., Schneider, T.D., and Gold, L., (1986) Quantitative analysis of the relationship between nucleotide sequence and functional activity. Nucleic Acids Res., 14, 6661-6679.
Sugimoto, N., Nakano, S., Yoneyama, M., and Honda, K., (1996) Improved thermodynamic parameters and helix initiation factor to predict stability of DNA duplexes. Nucleic Acids Res., 24, 4501-4505.
Suzuki, M., Yagi, N., and Finch, J.T., (1996) Role of base-backbone and base-base interactions in alternating DNA conformations. FEBS Lett., 397, 148-152.
Zadeh, L.A., (1965) Fuzzy sets. Information and Control., 8, 338-353.
Table 1. Examples of the sites with known activities available in the database ACTIVITY
Site |
Activity |
Reference |
||||
Name |
DNA |
Quantitative character |
Sc |
Min |
Max |
|
Cro-binding site |
Nat |
Association rate const |
ln |
19.1 |
19.9 |
Kim, 1987 |
CRP-binding site |
Nat |
CRP/DNA affinity |
ln |
-3.2 |
3.2 |
Gartenberg, 1988 |
E. coli promoter |
Mut |
Promoter strength |
-log |
0.26 |
2.1 |
Jonsson, 1993 |
C-protein-binding site |
Mut |
Transcription activity |
ln |
-6.2 |
1.8 |
Chiang, 1993 |
TATA box |
Mut |
TBP/DNA lifetime |
m |
1 |
185 |
Starr, 1995 |
TATA box |
Mut |
Bend, DNA/TBP comp |
(O) |
33 |
106 |
Starr, 1995 |
Transcription signal INR |
Mut |
INR/DNA affinity |
ln |
-4.6 |
1.3 |
Kraus, 1996 |
Transcription signal OCT-1 |
Mut |
Transcription activity |
ln |
-2.3 |
0.63 |
Boyd, 1995 |
Transcription signal YY1 |
Syn |
Repressing activity |
ln |
2.2 |
0.00 |
Hyde-DeRuyscher, 1995 |
Transcription signal USF |
Syn |
USF/DNA affinity |
ln |
3.8 |
100 |
Bendall, 1994 |
| PE1B/TATA box | Mut |
Transcription activity |
ln |
-1.4 |
1.4 |
Sax, 1995 |
Transcription signal IL-1 |
Mut |
Transcription activity |
ln |
-1.9 |
4.1 |
Kretsovali, 1995 |
2AP-induced mutation |
Nat |
Mutation frequency |
ln |
0.0 |
5.6 |
Coullondre, 1978 |
Nat, natural; Mut, mutant, Syn, synthetic; m, minute; Sc, scale; 2AP, 2-aminopurine.
Table 2. Examples of the DNA properties available in the database ACTIVITY
Property name |
Unit |
Min |
Max |
Reference |
Twist |
(O) |
31.1 |
41.4 |
Karas, 1996 |
Propeller |
(O) |
-17.3 |
-6.7 |
Gorin, 1995 |
Tip |
(O) |
-1.64 |
6.7 |
Karas, 1996 |
Inclination |
(O) |
-1.43 |
1.43 |
Karas, 1996 |
Tilt |
(O) |
-2.6 |
0.6 |
Gorin, 1995 |
Bend |
(O) |
2.16 |
6.74 |
Karas, 1996 |
Wedge |
(O) |
1.1 |
8.4 |
Shpigelman, 1993 |
Direction |
(O) |
-154 |
180 |
Shpigelman, 1993 |
Roll |
(O) |
-6.2 |
6.2 |
Suzuki, 1996 |
Rise |
Angstrom |
3.16 |
4.08 |
Karas, 1996 |
Slide |
Angstrom |
-0.4 |
1.6 |
Suzuki, 1996 |
Minor groove width (width) |
Angstrom |
4.62 |
6.40 |
Karas, 1996 |
Minor groove depth (depth) |
Angstrom |
8.79 |
9.11 |
Karas, 1996 |
Minor groove width size (size) |
Angstrom |
2.7 |
4.7 |
Gorin, 1995 |
Minor groove width distance (dist) |
Angstrom |
2.79 |
4.24 |
Gorin, 1995 |
Major groove width (WIDTH) |
Angstrom |
12.1 |
15.5 |
Karas, 1996 |
Major groove depth (DEPTH) |
Angstrom |
8.45 |
9.60 |
Karas, 1996 |
Major groove size (SIZE) |
Angstrom |
3.26 |
4.70 |
Gorin, 1995 |
Major groove distance (DIST) |
Angstrom |
3.02 |
3.81 |
Gorin, 1995 |
Clash strength |
r.u. |
0.00 |
2.53 |
Gorin, 1995 |
Bending mobility to minor groove |
r.u. |
1.02 |
1.27 |
Gartenberg, 1988 |
Bending mobility to major groove |
r.u. |
0.99 |
1.18 |
Gartenberg, 1988 |
Persistent length |
bp |
20 |
130 |
Hogan, 1987 |
Melting temperature |
o C |
36.7 |
136.1 |
Hogan, 1987 |
Probability to be contacting nucleosome core |
% |
1 |
18 |
Hogan, 1987 |
Enthalpy change |
kcal/mol |
-11.8 |
-5.6 |
Sugimoto, 1996 |
Entropy change |
cal/mol/K |
-28.4 |
-15.2 |
Sugimoto, 1996 |
Free energy change |
kcal/mol |
-2.8 |
-0.9 |
Sugimoto, 1996 |
r.u., relative unit
Table 3. Examples of the functional DNA sites analyzed by the system ACTIVITY
Site |
DNA feature found |
Significance |
|||||||
Name |
Position #1 |
n |
Activity, F |
Xk |
Region |
Property |
U |
r |
p |
PE1B TATA box |
Transc- |
11 |
Transcription |
X1 |
-32; -25 |
Pnucl |
0.36 |
-0.77 |
10-2 |
(Sax, 1995) |
ription |
activity |
X2 |
-29; -19 |
DIST |
0.41 |
0.86 |
10-3 |
|
start |
of alphaA- |
X3 |
-31; -25 |
Tilt |
0.38 |
-0.78 |
10-2 |
||
crystalline |
F=-39-0.1*X1+12*X2-X3 |
0.90 |
10-4 |
||||||
TATA box (mutant) |
TATA |
9 |
DNA bending |
X1 |
0, 9 |
Inclination |
0.19 |
0.76 |
0.05 |
(Starr, 1995) |
box start |
in TBP/TATA |
F=120.15+70.32*X1 |
0.76 |
0.05 |
||||
USF-binding site |
Synthetic |
14 |
USF/DNA |
X1 |
11, 15 |
Depth |
0.22 |
-0.78 |
10-3 |
(Bendall, 1994) |
DNA |
affinity |
X2 |
11; 20 |
Twist |
0.23 |
-0.86 |
10-4 |
|
start |
F=170-16.3*X1-0.7*X2 |
0.91 |
10-5 |
||||||
YY1-binding site |
site start |
21 |
Transcription |
X1 |
1, 12 |
Twist |
0.27 |
-0.76 |
10-2 |
(Hyde-DeRuyscher, 1995) |
repression |
F= 47.97 -1.37*X1 | 0.76 |
10-2 |
|||||
2AP-induced mutation |
Mutation |
26 |
Mutation |
X1 |
-1, 2 |
Tmelt |
0,20 | 0.90 |
10-5 |
(Coullondre, 1978) |
point |
frequency |
F=-8.5568+0.1585*X1 |
0.90 |
10-5 |
||||
Notes: n, total number of the site variants; Xk, feature selected; U, utility; r, linear correlation coefficient; p, significance of the linear correlation coefficient; Pnucl, probability to be contacting nucleosome core; Tmelt, melting temperature; depth, minor groove depth; width, minor groove width; WIDTH, major groove width; DIST, major groove width distance; and F=F0+S iFiXi, the linear regression (1) derived for predicting the site activity.
Fig. 1. Algorithm for generating the C-code program predicting the activity of a given site.
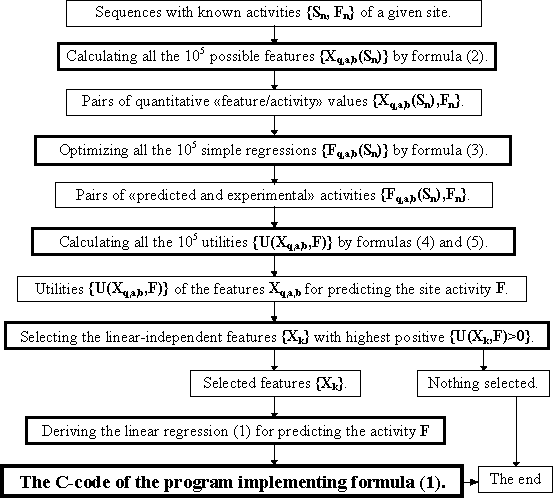
Fig. 2. Scheme of the distributed and intelligent database ACTIVITY.